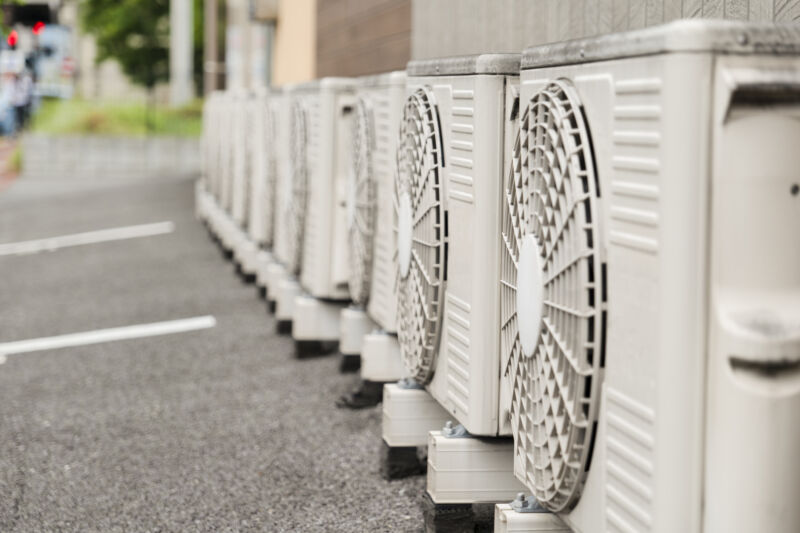
One of the more threatening aspects of climate change is the potential to unleash feedback, or situations where warming triggers changes that cause even more warming. Most of them are natural, such as a warmer ocean that can hold less carbon dioxide, resulting in even more greenhouse gases in the atmosphere. But at least one potential feedback has a very human element: air conditioning.
Much of the carbon dioxide we emit comes from electricity production. The heat generated by these emissions causes people to use air conditioning more often, leading to increased electricity consumption, which leads to further emissions. It’s a feedback that will remain a threat until we succeed in making the power grid greener.
A new report released this week looks at that feedback from the perspective of our climate goals, examining how much more air conditioning is likely to be used in a world with our backup target of 2°C warming, and compares it to one where we actually achieve our primary goal of limiting warming to 1.5°C. The answer is that it makes a big difference, but the effects are not evenly distributed across countries.
Absolute and relative unpleasantness
There is no objective benchmark for when to turn on the air conditioning. People have different heat tolerances and many people don’t even have access to air conditioning. But studies in the area usually use a measure called cooling degree days. These often use an outside temperature where things like office buildings or shopping malls would start using their air conditioning – often around 18°C (65°F). For each day warmer than the target temperature, the cooling degree days are increased by the number of degrees above the target temperature.
So, if you set a baseline of 18°C and have a day of 25°C, that will be recorded as seven days of extra cooling. So the figure not only measures the need to turn on cooling equipment, but also gives an idea of how hard that equipment will have to work.
For the new work, a UK-based team used climate models to run as a distributed computing project via climateprediction.net. For each of the two conditions (+1.5° and +2.0°C) 700 runs were performed and the typical temperatures in each grid of a world map were calculated. Those results were in turn used to calculate cooling degree days for each of the two scenarios.
The researchers then made two comparisons. One was the absolute difference between the 1.5° and 2.0° worlds, the total number of additional cooling degree days added by the additional warming. You can think of this as a misery index, recording how much worse things will be in a given location.
The second metric can be thought of as a preparedness index, measured by the size of the relative change. Thus, places that rarely experience days with one degree of cooling in a 1.5°C world can have a big relative difference if they suddenly experience dozens of days with the extra heat. And since those degree days were so rare to begin with, those countries likely don’t have access to air conditioning equipment (or the electrical grid to power it) to cope with the unprecedented burden.

