

Mike Kemp/Getty Images
Baseball has long been a popular research topic for physicists, largely because of the complex aerodynamics of a baseball in flight. Traditionally, scientists have relied on wind tunnel experiments to measure important properties such as speed, spin, lift and drag, but this approach cannot precisely capture small shifts in drag. And even small shifts in drag can have big effects, such as a dramatic increase in home runs.
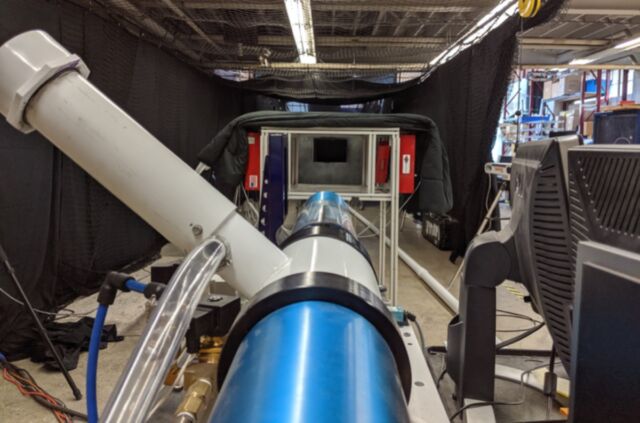
So two physicists developed a laser-guided velocity measurement system to measure the change in speed of a baseball in mid-flight and then use that measurement to calculate acceleration, the various forces acting on the ball, and lift and drag. They described their approach in a recent paper published in the journal Applied Sciences and suggested it could be used for other ball sports such as cricket and football.
Each moving ball leaves a trail of air as it travels; the inevitable resistance slows the ball down. The trajectory of the ball is affected by diameter and speed and by small irregularities on the surface. Baseballs aren’t completely smooth; they have figure-eight stitching. Those stitches are bumpy enough to affect the airflow around the baseball as it’s tossed to home plate. As a baseball moves, it creates a vortex of air around it, commonly known as the Magnus effect. The raised seams allow air to circulate around the ball, creating high pressure zones in various places (depending on the field type) that can cause deviations in the trajectory.
NIST
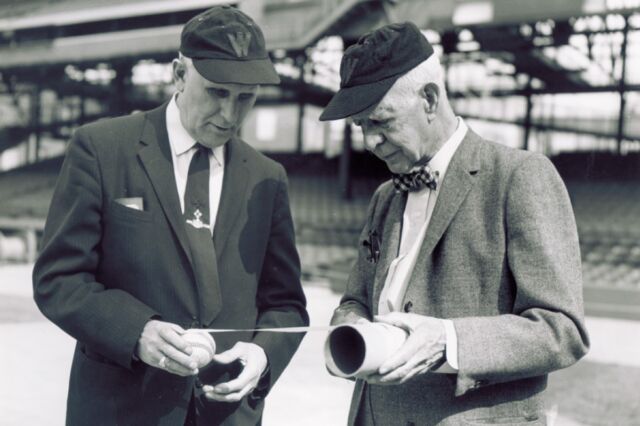
Modern baseball physics began in the 1940s with the efforts of a physicist named Lyman Briggs. Briggs was a baseball fan who was intrigued by the question of whether a curveball actually bends. Initially, he enlisted the help of the Washington Senators pitching staff at Griffith Stadium to measure the spin of a pitched ball; the idea was to determine how much a baseball’s curve depends on its spin and speed.
Briggs followed with wind tunnel experiments at the National Bureau of Standards (now the National Institute of Standards and Technology) to get even more accurate measurements, since he could control most variables. He found that spin rather than speed was the most important factor in causing a pitched ball to curve and that a curveball can drop as much as 17.5 inches as it travels from pitcher mound to home plate.
Since then, physicists have been eagerly studying various aspects of baseball. For example, in 2006, mathematicians studied the effects of elevation in Major League Baseball (MLB) slugging rates (the total number of bases divided by the number of at bats) by building a statistical model. They found that the slugging rate at Coors Field in Denver, Colorado (aka the “Mile-High City”) was about 9.2 percent higher than at middle elevations (between 500 and 1,100 feet) and 12.5 percent higher. than at altitudes below 500 feet. No wonder the stadium has a reputation for being home run-friendly.
In 2018, we reported on a Utah State University study to explain the fastball’s unexpected turn in experiments on Little League baseballs. The scientists at the USU shot the balls one by one through a smoke-filled chamber. Two red sensors detected the balls as they whizzed past, activating lasers that acted as flashbulbs. They then used particle frame rate measurement to calculate the airflow at a particular spot around the ball.
Washington State University
The current study was inspired by an unusual recent shift in home run rates in the MLB. Home runs are usually tracked by a metric known as HR/BB (home runs per batted ball). According to the authors, the HR/BB ratio generally fell between 0.03 and 0.04 from 1960 to 2015. That changed drastically in the 2015 season when the HR/BB ratio increased rapidly, to 0.053 in 2017. It was alarming enough that the MLB actually commissioned a panel to investigate. The panel released its report in 2018 and concluded that a small decrease in air resistance on the baseballs was the culprit.
That, in turn, has drawn attention in recent years to developing better methods for measuring a baseball’s resistance in flight. As we reported before, the drag coefficient describes how much the flowing air “sticks” to the surface of the ball. The faster the ball moves, the less “sticky” the ball becomes. Usually the wakes are bigger and the resistances are higher at slow speeds. But when the ball reaches a critical speed threshold, it experiences what’s called a “drag crisis.” The wake suddenly shrinks and the drag plummets as the airflow abruptly shifts from laminar (smooth) to turbulent.
These kinds of experiments are usually done in wind tunnels. But that method has some pronounced shortcomings in measuring resistance accurately. “You have to hold the ball somehow and that means there will always be an imperfection if you use a wind tunnel to measure drag,” said study co-author Lloyd Smith of Washington State University.