Tierney et. already.
In a study published in PNAS, University of Arizona professor Jessica Tierney and colleagues created complete global maps of the carbon-driven warming that occurred in the Paleocene Eocene Thermal Maximum (PETM), 56 million years ago.
While the PETM has some parallels to current warming, the new work contains some unexpected results: the climate response to CO2 was then about twice as strong as the current best estimate of the Intergovernmental Panel on Climate Change (IPCC). But changes in rainfall patterns and the amplification of warming at the poles were remarkably consistent with modern trends, despite being a very different world at the time.
An other world
The warming of the PETM was caused by a geologically rapid release of CO2, mainly due to a convulsion of magma in the Earth’s mantle where Iceland now lies. The magma penetrated oil-rich sediments in the North Atlantic and boiled CO2 and methane. It took an already warm, high CO2 climate and made it hotter for tens of thousands of years, threatening some deep-sea creatures and some tropical plants with extinction. Mammals evolved smaller and there were large migrations across continents; crocodiles, hippo-like creatures, and palm trees all thrive just 500 miles from the North Pole, and Antarctica was ice-free.
As our climate warms, scientists are increasingly looking to past climates for insights, but they are hampered by uncertainties in temperature, CO2 levels and the exact timing of changes – prior work on the PETM had temperature uncertainties on the order of 8° to 10°C, for example. Now Tierney’s team has narrowed that uncertainty range to just 2.4°C, showing that the PETM has warmed by 5.6°C, a refinement of the earlier estimate of about 5°C.
“We were really able to narrow that estimate relative to previous work,” Tierney said.
The researchers also calculated the CO2 levels before and during the PETM derived from isotopes of boron measured in fossil plankton shells. They found CO2 was about 1120 ppm just before the PETM, rising to 2020 ppm at its peak. In comparison: pre-industrial CO2 was 280 ppm and we are currently at about 418 ppm. The team was able to use this new temperature and CO2 values to calculate how much the planet has warmed in response to a doubling of CO2 values, or the “Equilibrium Climate Sensitivity” for the PETM.
Highly sensitive
The IPCC’s best estimate for climate sensitivity in our time is 3°C, but that comes with a great deal of uncertainty – it could be between 2 and 5 °C – because of our imperfect knowledge of feedbacks in the Earth system. If the sensitivity turns out to be on the high side, then we will warm up more for a certain amount of emissions. Tierney’s research found that the PETM climate sensitivity was 6.5 °C – more than double the IPCC’s best estimate.
A higher number is “not that surprising,” Tierney told me, because previous research has shown the Earth’s response to CO. had shown2 is stronger at higher CO2 levels of the Earth’s past. Our climate sensitivity won’t be that high: “We don’t expect to experience a climate sensitivity of 6.5°C tomorrow,” explains Tierney.
However, their paper suggests that if we continue to increase CO2 levels, it will increase the temperature response to that CO2 higher. “We can expect some degree of heightened climate sensitivity in the near future, especially as we emit more greenhouse gases,” Tierney said.
Mapping the climate through “Data Assimilation”
The new, sharper picture comes from the way Tierney’s team dealt with geologists’ perennial problem: We don’t have data for every place on the planet. Geologic data for the PETM is limited to sites where sediments from that time are preserved and accessible – typically through a borehole or outcrop on land. Any conclusions about global climate must be scaled up from those scarce data points.
“It’s actually a tough problem,” Tierney noted. “If you want to understand what’s happening spatially, it’s very difficult to do that based on the geological data alone.” So Tierney and colleagues borrowed a technique from weather forecasting. “What weather people do is they use a weather model, and as the day goes on, they take measurements of wind and temperature, and then they incorporate it into their model…” Tierney said.
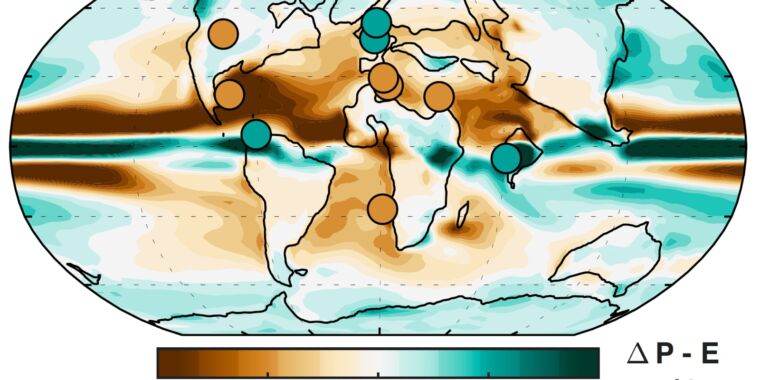
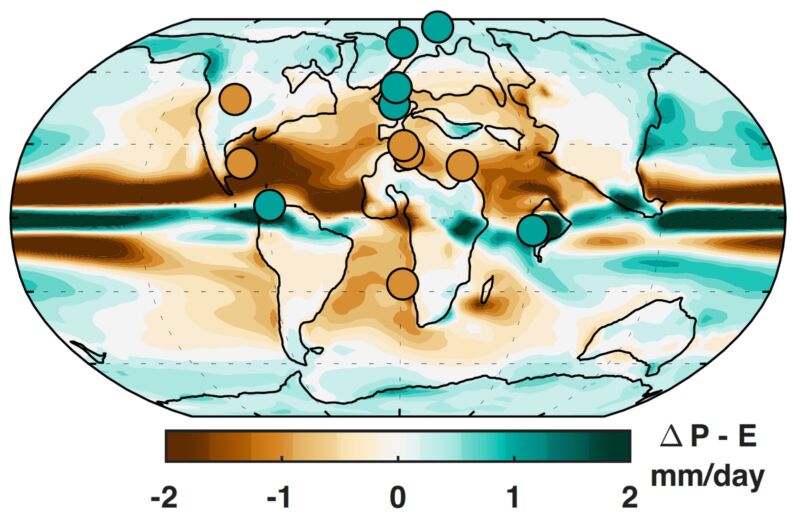
Instead of thermometers, her team used temperature measurements from the remains of microbes and plankton preserved in 56-million-year-old sediments. Instead of a weather model, they used a climate model with Eocene geography and no ice sheets to simulate the climate just before and at the peak of PETM heat. They ran the model a number of times, varying CO2 levels and the Earth’s orbit configuration because of the uncertainties therein. They then used the microbe and plankton data to select the simulation that best fit the data.
“The idea is really to take advantage of the fact that model simulations are spatially complete. But they’re models, so we don’t know if they’re right. The data knows what happened, but it’s not spatially complete,” explains Tierney. “So by mixing them together, we get the best of both worlds.”
To see how well their blended product matched reality, they checked it against independent data from pollen and leaves, and from sites not included in the blending process. “They were a really good match, which is somewhat reassuring,” Tierney said.
“The novelty of this study is to use a climate model to rigorously work out which climate condition best fits the data, both before and during the PETM, yielding patterns of climate change around the world and a better estimate of the global mean temperature change is obtained,” said Dr. Tom Dunkley Jones of the University of Birmingham, who was not part of the study.